Data and Databooks
This page provides an overview of Atomica’s internal representation of databooks. Project data for an application is specified in a ‘databook’. This is an Excel file that contains
A listing of which populations a simulation will have
A specification of which transfers are present
Population and time specific values for characteristics, parameters, transfers, and interactions
ProjectData is a Python object containing the data, and it has methods to convert to and from the databook spreadsheet.
[1]:
import pandas as pd
import atomica as at
import matplotlib.pyplot as plt
import numpy as np
import sciris as sc

with at.Quiet(show_warnings=False): # Temporarily suppress any warnings from the output
    F = at.ProjectFramework(at.LIBRARY_PATH / "tb_framework.xlsx")
    data = at.ProjectData.from_spreadsheet(at.LIBRARY_PATH / "tb_databook.xlsx",F)
We have now loaded in a framework, and a corresponding databook as a ProjectData object. The ProjectData object contains a number of attributes
popsis an odict storing populations, their full names, and the population type (if multiple population types are present)tvecstores the default time array associated with the data (users can override this on a per-table basis)transfersandinteractionsstore pairwise time series linking populationstdvestores a dict ofTimeDependentValueEntrytables for characteristics and parameterstdve_pagesstores a dict assigning TDVE tables to worksheets
There are three basic elements to the databook
The population table
TimeDependentConnectiontables which are used for transfers and interactions. These have a ‘to’ and a ‘from’ populationTimeDependentValueEntrytables which are used for characteristics and parameters
TimeSeries objects
Time-varying data is backed by the TimeSeries object defined in structure.py. This object stores sparse time-varying data, together with an assumption. This allows it to keep track of both assumption and time-varying values entered in a databook. It has a few key properties
[2]:
ts = at.TimeSeries(t=[2014,2015],vals=[1,2])
A TimeSeries has t and vals attributes that store the time varying data
[3]:
ts.t
[3]:
[2014, 2015]
[4]:
ts.vals
[4]:
[1.0, 2.0]
The values can be modified using the insert and remove methods. These preserve the order of the times. Notice that the remove method removes data based on the time value rather than the index.
[5]:
ts.insert(2016,3)
ts.remove(2015)
ts.vals
[5]:
[1.0, 3.0]
A TimeSeries object also has an interpolate method to query its value at arbitrary times. It uses the same interpolation as for parameters, with constant extrapolation
[6]:
t = np.arange(2013,2018,0.2)
plt.plot(t,ts.interpolate(t))
[6]:
[<matplotlib.lines.Line2D at 0x7f7bfdc36420>]

One of the special features of the TimeSeries object that caters for databook entry is the fact that it can independently store the constant assumption value. This is set by inserting a value with no time associated with it
[7]:
ts2 = at.TimeSeries()
ts2.insert(None,2)
ts2.assumption
[7]:
2.0
Since the data for a TimeSeries could be in assumption or in vals, the method get_arrays allows you to get time and value arrays for the content of the TimeSeries
[8]:
t,v = ts.get_arrays()
print(t)
print(v)

t,v = ts2.get_arrays()
print(t)
print(v)
[2014 2016]
[1. 3.]
[nan]
[2.]
However, the most common usage for the TimeSeries is to turn sparse data into full interpolated arrays. The interpolate method automatically manages the assumption and the time dependent values, so that you don’t have to do this yourself:
[9]:
t = np.arange(2013,2018,0.2)
plt.plot(t,ts.interpolate(t),label='Time varying')
plt.plot(t,ts2.interpolate(t),label='Assumption')
plt.legend()
[9]:
<matplotlib.legend.Legend at 0x7f7bed48a660>

The TimeSeries object also has a units property that lets it store the units of the quantity entered in the databook.
In general, whenever the databook has a time-dependent values row with an assumption and some year-specific data, the corresponding object used to store the data on that row is a TimeSeries
Population table
The population table is very basic:
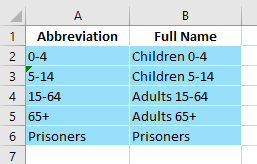
If population types are present (e.g., if modelling both humans and a vector like mosquitos) there will be additional columns in this table - see the documentation pages for ‘Population types’ for more information.
TimeDependentConnections
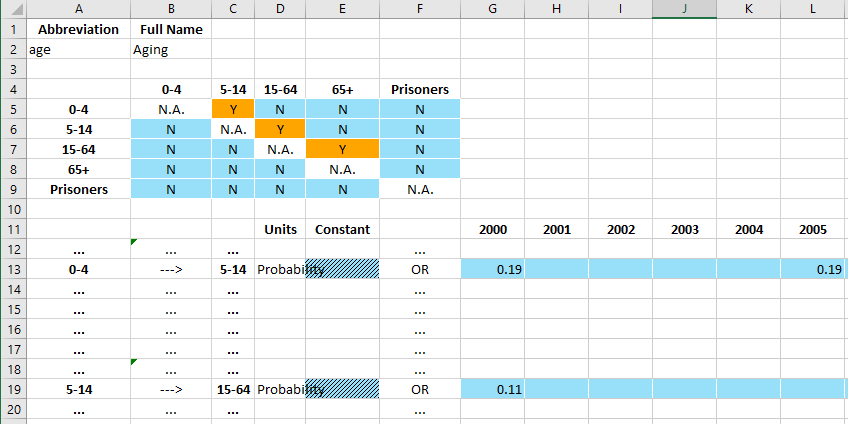
A TimeDependentConnections table consists of three elements
A code name/full name table at the top
A matrix of Y/N values that controls which time series appear on the page
A set of time series inputs where the user enters time-varying data
This table is managed by the TimeDependentConnections object in excel.py which has
A code name
A full name
The type (whether it’s an interaction or a transfer - the difference being, a transfer cannot have any entries on the diagonal i.e. within the same population)
A list of population names
A list of times
A dict of
TimeSeriesobjects keyed by the(to,from)populaton namesA method
from_tables()to construct aTimeDependentConnectionsinstance based on the rows in the spreadsheetA method
write()that takes in a sheet and a start row, and writes the content for the object to the spreadsheet
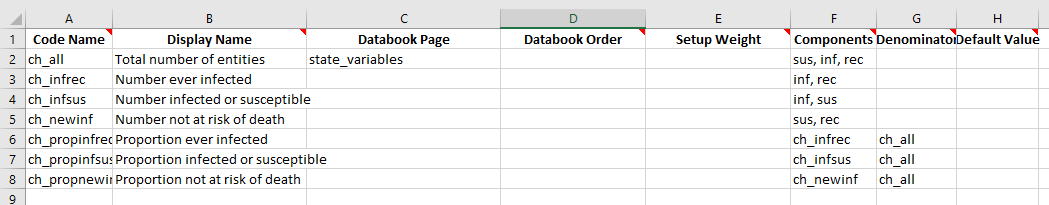
TimeDependentValuesEntry
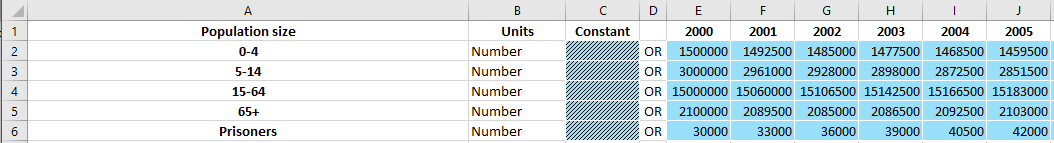
A TimeDependentValuesEntry consists of a single element with
The full name of the quantity at the top left
The left column with population names
Value entry cells for contant and year-specific values
A code name/full name table at the top A matrix of Y/N values that controls which time series appear on the page A set of time series inputs where the user enters time-varying data
This table is managed by the TimeDependentValuesEntry object in excel.py which has
A name
The time vector
A dict of
TimeSeriesobjects keyed by the population nameA method
from_rows()to construct aTimeDependentValuesEntryinstance based on the rows in the spreadsheetA method
write()that takes in a sheet and a start row, and writes the content for the object to the spreadsheet
It is possible to optionally specify a row with the population set to ‘All’. This row will then serve as a fallback for any populations that are otherwise missing in the table. Since ‘All’ is a reserved keyword, it is guaranteed to not correspond to an actual population. If a row with ‘All’ is present, it is not necessary to specify any other data in the TDVE table. However, if population-specific rows are present, they will take precedence. The values for the ‘All’ population row are processed
when constructing a ParameterSet - the ParameterSet will contain time series values for every population, and will read them from the ‘All’ row of the TDVE table as required. In that sense, having a row for ‘All’ in the TDVE table is functionally equivalent to the databook containing population specific rows for every population, with the same data appearing on every row.
Modifying databooks
A ProjectData instance is essentially a Python representation of the databook spreadsheet, and you can freely move between either representation depending on which is easiest to work with for any given task. In particular, this functionality facilitates programmatic editing of the databook, which can be useful in several common workflows.
Creating a blank databook
Starting from a framework, you can make a blank databook using the at.ProjectData.new() function:
[10]:
F = at.ProjectFramework('sir_framework.xlsx')
D = at.ProjectData.new(framework=F, pops=1, transfers=0, tvec=np.arange(2020, 2041))
This has produced an empty ProjectData instance. It can be converted and saved to a spreadsheet databook format using the save method
[11]:
D.save('sir_databook_1.xlsx')
Object saved to /home/vsts/work/1/s/docs/examples/databooks/sir_databook_1.xlsx.
Pre-populating data
The tables in the databook are stored in the ProjectData instance under three member variables
tdvestores the compartment, characteristic, and parameter input tablestransfersstores any inter-population transfers such as aginginteractionsstores any cross-population variable weights, such as those used for computing force of infection
The entries in tdve exactly match the quantities in the framework flagged as appearing in the databook, while the entries in transfers and interactions are databook-specific (because they depend on the populations defined in the databook). By accessing these variables, we can programatically read and write values in the data. For example:
[12]:
D.tdve.keys()
[12]:
['sus',
 'ch_all',
 'ch_prev',
 'transpercontact',
 'contacts',
 'recrate',
 'infdeath',
 'susdeath']
[13]:
D.tdve['sus']
[13]:
<atomica.excel.TimeDependentValuesEntry at 0x7f7bf3b0f5c0>
[<class 'atomica.excel.TimeDependentValuesEntry'>]
————————————————————————————————————————————————————————————————————————
Methods:
  from_rows()             write()
————————————————————————————————————————————————————————————————————————
Properties:
  has_data
————————————————————————————————————————————————————————————————————————
     allowed_units: ['Number']
assumption_heading: 'Constant'
           comment: None
       default_all: False
              name: 'Susceptible'
          pop_type: 'default'
                ts: #0: 'pop_0':
                    <atomica.utils.TimeSeries at 0x7f7bf00d6160>
                    [<cl [...]
     ts_attributes: {'Provenance': {}}
              tvec: array([2020, 2021, 2022, 2023, 2024, 2025, 2026,
                    2027, 2028, 2 [...]
  write_assumption: None
 write_uncertainty: True
       write_units: True
————————————————————————————————————————————————————————————————————————
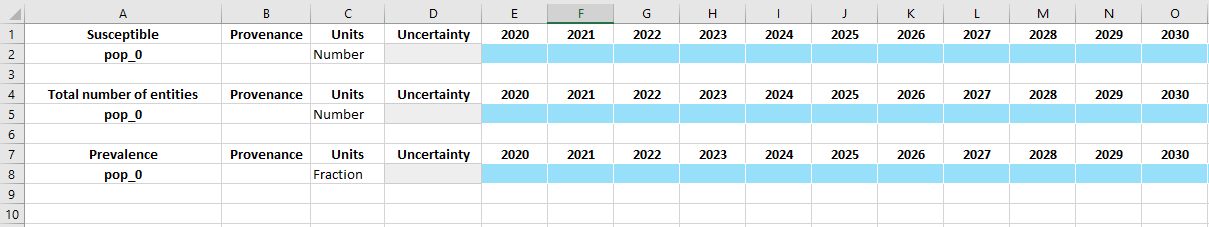
The tdve entry for the sus variable contains various metadata controlling which columns appear in the databook. The values are stored within TimeSeries instances in the ts attribute, keyed by population:
[14]:
D.tdve['sus'].ts['pop_0']
[14]:
<atomica.utils.TimeSeries at 0x7f7bf00d6160>
[<class 'atomica.utils.TimeSeries'>]
————————————————————————————————————————————————————————————————————————
Methods:
  copy()                  interpolate()           remove_between()
  get()                   remove()                sample()
  get_arrays()            remove_after()          insert()
  remove_before()
————————————————————————————————————————————————————————————————————————
Properties:
  has_data                has_time_data
————————————————————————————————————————————————————————————————————————
  _sampled: False
assumption: None
     sigma: None
         t: []
     units: 'Number'
      vals: []
————————————————————————————————————————————————————————————————————————
Since the various time series in the databook could be stored in either a TDVE table or a transfer or an interaction, the ProjectData.get_ts() can be used to access variables by name and population, regardless of where in the ProjectData instance they are stored:
[15]:
D.get_ts('sus','pop_0')
[15]:
<atomica.utils.TimeSeries at 0x7f7bf00d6160>
[<class 'atomica.utils.TimeSeries'>]
————————————————————————————————————————————————————————————————————————
Methods:
  copy()                  interpolate()           remove_between()
  get()                   remove()                sample()
  get_arrays()            remove_after()          insert()
  remove_before()
————————————————————————————————————————————————————————————————————————
Properties:
  has_data                has_time_data
————————————————————————————————————————————————————————————————————————
  _sampled: False
assumption: None
     sigma: None
         t: []
     units: 'Number'
      vals: []
————————————————————————————————————————————————————————————————————————
To insert a value, we can simply add the value to this time series
[16]:
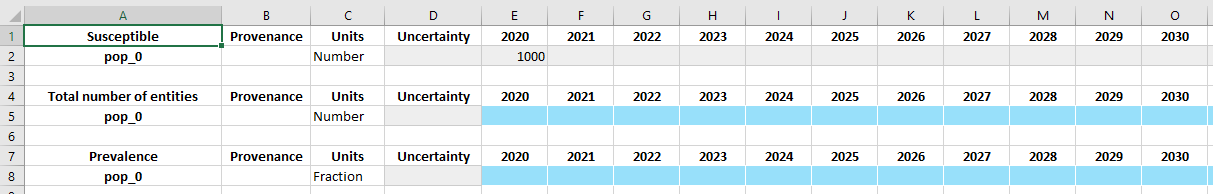
D.tdve['sus'].ts['pop_0'].insert(2020, 1000)
Note that the year must be present in the TDVE’s tvec in order for the values to be written to the databook. To add different years on an individual basis, manually add the years to the tvec first.
[17]:
D.save('sir_databook_2.xlsx')
Object saved to /home/vsts/work/1/s/docs/examples/databooks/sir_databook_2.xlsx.
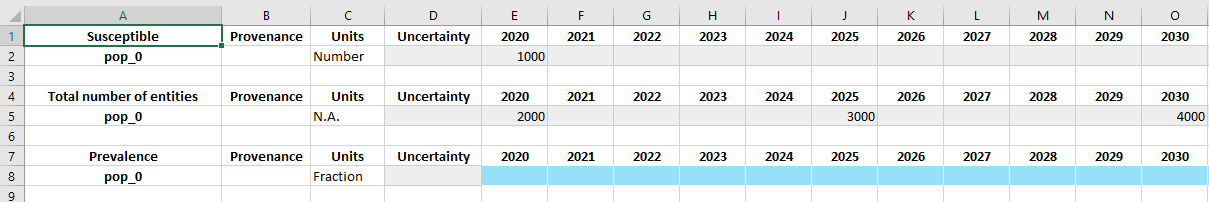
Now when the ProjectData instance is saved to disk, the inserted value is written into the spreadsheet. As an alternative to inserting values one-by-one, you could alternatively replace the entire timeseries:
[18]:
D.tdve['ch_all'].ts['pop_0'] = at.TimeSeries([2020, 2025, 2030], [2000, 3000, 4000], units='Number')
D.tdve['ch_prev'].ts['pop_0'] = at.TimeSeries([2021, 2022], [0.3, 0.28], units='Fraction')

D.save('sir_databook_3.xlsx')
Object saved to /home/vsts/work/1/s/docs/examples/databooks/sir_databook_3.xlsx.
This approach can be extended to pre-populate many different variables in a script. For example, a common workflow is to have a collection of raw data files from various sources. Then to produce a databook, a blank databook is created from the framework, the raw inputs read into dataframes, and then the values inserted into the appropriate time series before writing the databook to disk. Any additional missing values can then be populated manually before the databook is then loaded back and used to run simulations. This workflow is particularly useful if conducting an analysis in multiple settings, where several databooks are required. The input data spreadsheet might correspond to one type of quantity (e.g., population size) for every country all from a single source, and a script to generate databooks would read data for a specific country from each of the input spreadsheets to generate multiple databooks.
Adding a variable
Another common use case is when a framework has been updated to contain a new variable. How can this new variable be added to an existing databook? The easiest way to do this is actually to simply make a copy of the sub-table in Excel, populate values as required, and then load the new databook. For example, consider modifying the framework to contain:
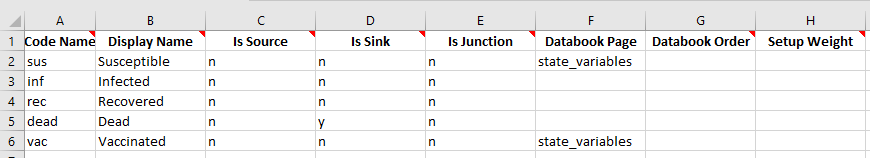
Suppose we try to load the existing databook using this framework:
[19]:
F2 = at.ProjectFramework('sir_framework_2.xlsx')
D2 = at.ProjectData.from_spreadsheet('sir_databook_3.xlsx', framework=F2)
The databook can be loaded even though the vac table is missing. However, the databook will not pass validation because it does not contain the missing variable
[20]:
try:
    D2.validate(F2)
except Exception as E:
    print(E)
The databook did not contain a required TDVE table named "Vaccinated" (code name "vac")
Adding a new TDVE to D2.tdve['vac'] would be possible - however, the additional metadata such as the allowed units for that variable would need to be added as well, and it would need to be assigned to a databook page, so overall this would be somewhat fragile and error prone. Instead, an option could be to make a new databook from the framework, and copy any relevant TDVEs from the old databook to the new databook. For example:
[21]:
D1 = at.ProjectData.from_spreadsheet('sir_databook_3.xlsx', framework=F)
D2 = at.ProjectData.new(framework=F2, pops=1, transfers=0, tvec=np.arange(2020, 2041))
for k,v in D1.tdve.items():
    if k in D2.tdve:
        D2.tdve[k] = v
D2.save('sir_databook_4.xlsx')
Object saved to /home/vsts/work/1/s/docs/examples/databooks/sir_databook_4.xlsx.
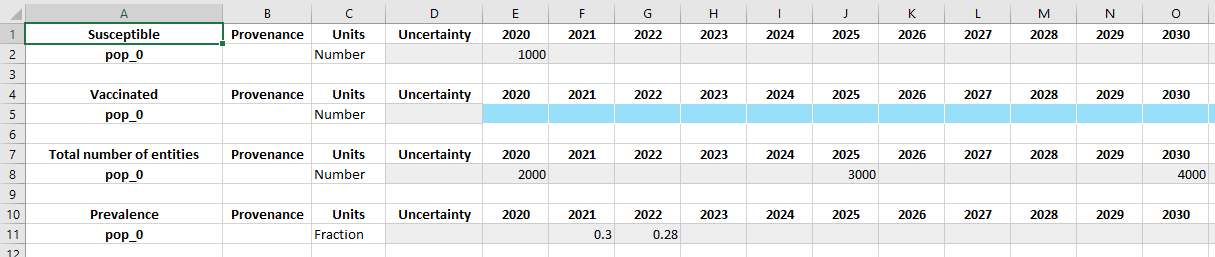
Notice how the sheet now contains all of the original data, as well as the new ‘Vaccinated’ table. However, this approach has the limitation of requiring access to the original framework.
In general, the preferred workflow for adding new variables to the databook is to simply edit the existing databook in Excel to match the required format, by copying-and-pasting the existing tables. Any issues with formatting can be tidied by loading the databook into Atomica and saving it back, to re-write it with standard formatting.
Removing a variable
Removing a variable follows a similar workflow as adding a variable. Suppose we have now removed the ch_prev variable (‘Prevalence’) from the databook:
[22]:
F3 = at.ProjectFramework('sir_framework_3.xlsx')
D3 = at.ProjectData.from_spreadsheet('sir_databook_3.xlsx', framework=F3)
D3.validate(F3);
Unlike the previous example where a new variables was required, the existing databook is valid for use with the new framework, because the additional variable is simply surplus and does not otherwise interact with the model. However, to remove it, you can otherwise delete it from the dictionary:
[23]:
del D3.tdve['ch_prev']
D3.tdve_pages['State Variables'].remove('ch_prev')
D3.save('sir_databook_5.xlsx')
Object saved to /home/vsts/work/1/s/docs/examples/databooks/sir_databook_5.xlsx.
Notice that the tdve_pages attribute maps TDVE entries (like ch_prev) to databook sheets (like 'State variables'):
[24]:
D3.tdve_pages
#0: 'State Variables': ['sus', 'ch_all']
#1: 'Parameters':      ['transpercontact', 'contacts', 'recrate', 'infdeath',
'susdeath']
[24]:
You can use the tdve_pages attribute to move tables from one sheet to another. However, that also means that if you add or remove an entry from tdve you will need to make a corresponding change to tdve_pages.
In general, the preferred workflow for removing variables from a databook is to simply delete the relevant rows from the existing databook.
Add/remove populations
Adding or removing populations requires modifying the rows in every TDVE and TDC instance contained in the databook. Therefore, the ProjectData instance provides methods to facilitate these operations:
[25]:
D3.add_pop(code_name='adults', full_name='Adults')
D3.add_pop(code_name='children', full_name='Children')
D3.save('sir_databook_6.xlsx')
Object saved to /home/vsts/work/1/s/docs/examples/databooks/sir_databook_6.xlsx.
The new populations now appear on the population definitions sheet, and in every TDVE table.


Removing a population can be done in much the same way:
[26]:
D3.remove_pop('children')
D3.save('sir_databook_7.xlsx')
Object saved to /home/vsts/work/1/s/docs/examples/databooks/sir_databook_7.xlsx.

Finally, a population can be renamed using the ‘rename_pop’ method. This is different to adding a new population with a new name and then removing the original one, because it preserves any data already entered:
[27]:
D3.rename_pop('pop_0', new_code_name='general', new_full_name='General')
D3.save('sir_databook_8.xlsx')
Object saved to /home/vsts/work/1/s/docs/examples/databooks/sir_databook_8.xlsx.

Notice that the data values that were previously entered for the pop_0 population have been preserved.
Add/remove transfers and interactions
Transfers and interactions can be added or removed in the same way as populations, using
ProjectData.add_transfer()ProjectData.rename_transfer()ProjectData.remove_transfer()ProjectData.add_interaction()ProjectData.remove_interaction()
Changing databook years
The year range in the databook is defined at the TDVE/TDC level, and therefore each quantity can have a different set of time values. In Excel, to add an extra year to a table, simply add an extra column to the appropriate variable. When programatically modifying the time points at the variable level, it’s important to make the change at the tvec level rather than the ts (timeseries) level, so that the change propagates to the databook when exported. This is shown in the example above.
To change the data entry years for the entire databook, the ProjectData.change_tvec() method can be used:
[28]:
D3.change_tvec(np.arange(2020, 2031, 0.5))
D3.save('sir_databook_9.xlsx')
Object saved to /home/vsts/work/1/s/docs/examples/databooks/sir_databook_9.xlsx.

Further spreadsheet modification
Sometimes it is useful to programatically interact with the spreadsheet without writing it to disk - for example, adding an extra sheet, or returning the spreadsheet for download. There are actually three output methods available in the ProjectData class
ProjectData.to_workbook()which returns aBytesIOinstance and an openxlsxwriter.WorkbookProjectData.to_spreadsheet()which takes the output ofto_workbook(), flushes and closes theWorkbook, and returns aScirisSpreadsheetinstanceProjectData.save()which takes the output ofto_spreadsheet()and writes it to disk
For example, to add an extra sheet to the workbook:
[29]:
f, workbook = D3.to_workbook() # Get an xlsxwriter workbook instance
worksheet = workbook.add_worksheet('Extra worksheet') # Add a new worksheet
worksheet.write(0, 0, 'Example') # Add some content to the cells
worksheet.write(0, 1, 'Content')
workbook.close()  # Close the workbook to flush any xlsxwriter content
spreadsheet = sc.Spreadsheet(f)  # Wrap it in a spreadsheet instance
spreadsheet.save('sir_databook_10.xlsx')
Object saved to /home/vsts/work/1/s/docs/examples/databooks/sir_databook_10.xlsx.
Now the spreadsheet contains an additional sheet:

